
Okay, so my attempt at a clever title is lacking here, but the idea in my brain still stands and seems sort of valid.
Last Friday, my Math 7 crew needed support transitioning back to the curriculum after several days of end-of-quarter review activities, and taking a district “quarterly” benchmark test. Given that it was a 4-day school week, and three days prior were dedicated to the aforementioned tasks, it had been an entire week since we’d talked about equal ratios and started exploring the concept of “proportional”. The previous Friday, students had explored several scenarios to compare and contrast linear proportional and non-proportional relationships using tables of values (one where someone earned an hourly wage, and one where someone had already saved some money and was saving another consistent, additional amount, weekly) and hinting at what graphs of these relationships might look like.
Fast-forward to a week later. I wanted students to build on the tables and patterns we’d explored before, and continue to extend these to graphs.
“… that was too big…”
As a warm-up (that subsequently took 2/5 of the class period) students were given an empty coordinate plane and a few strategically-chosen ordered pairs. We tried to recall vocabulary like “origin”, how to label the axes, which quadrant was which, and how to plot a collection of ordered pairs that, if graphed correctly, would form a beautiful hexagon. Taking a lap around the room… I saw graphed polygons… and… other… things. It certainly didn’t hurt to address graphing ideas with these kiddos. I knew at this point that if our goal was to explore proportional and nonroportional relationships, graphing them by hand was an additional skill-set that we’d need to surely revisit.
“… that was too small…”
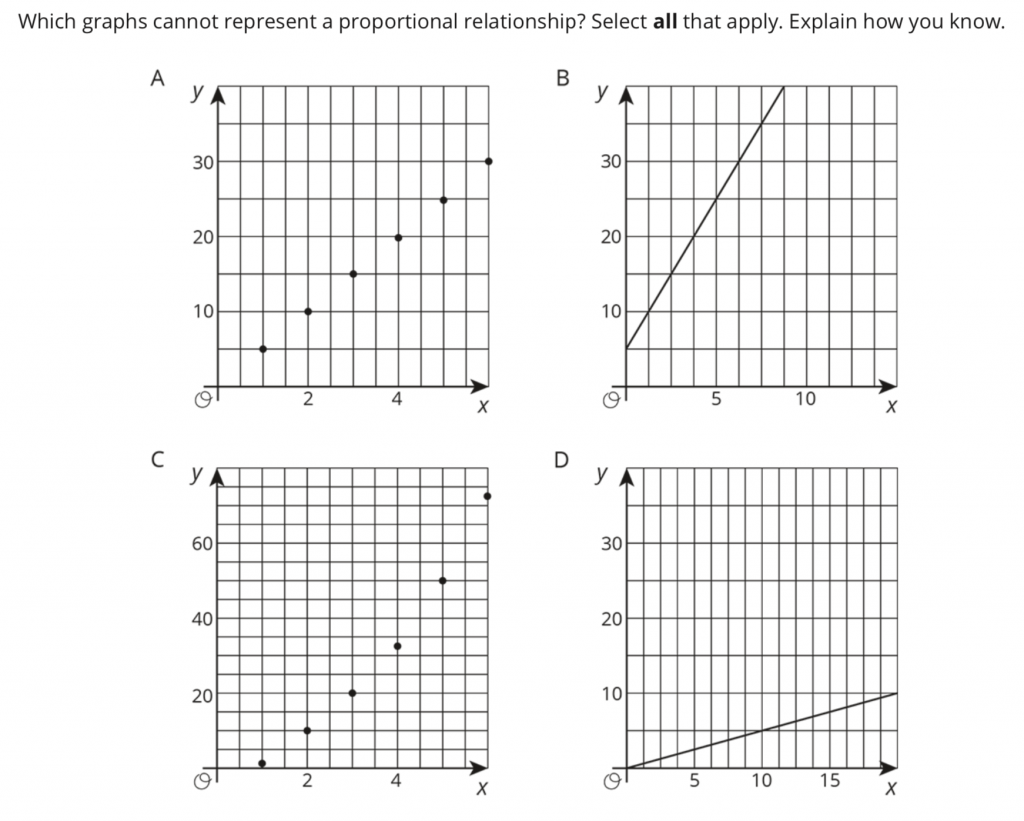
On the other hand, the instructional resource we use (a.k.a “the book”) simply states… “If the graph makes a straight line through the origin, it’s proportional.” These sorts of “quickies” are what students latch onto, without understanding more deeply the WHY. If we provide already-done graphs on worksheets to students and ask, “Is it proportional?”, and all they say is, “Yes, it goes through the origin” or “No, it doesn’t go through the origin”… this “quickie” explanation can extend to when students examine tables of values too. If their thinking halts here, and they don’t see (0, 0) in a table, they can make false assumptions.
On the back of the coordinate plane 40%-of-the-class-period warm-up, I copied this resource from Illustrative Mathematics. Students had discussions in their groups, ensured that they’d “answered the question asked” at the top of the prompt, and we had a share-out. Yes, the “line through the origin thing” is true, but I wanted to be sure we hadn’t lost the idea of relationships (Are there patterns between the x-coordinates? y-coordinates? Are equal ratios happening?)
“… that was JUST RIGHT.”
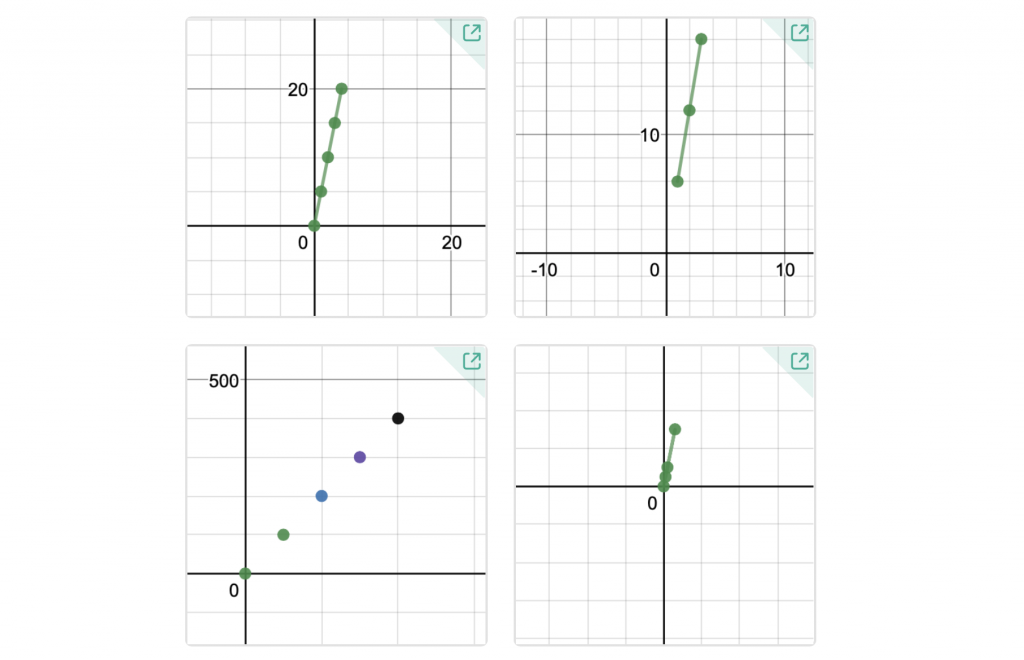
Lastly, I asked students to do what often is “the magic word” to seal understanding… “create”. I used Apple Classroom to navigate students’ iPads swiftly to student.desmos.com and used Teacher Pacing on this activity to limit their access to screen 1 only. Students talked in their groups as I asked them each to “create a proportional relationship you think no one else will.” They were excited to zoom in and out, seeing that this coordinate plane was quite different than the others we’d seen on worksheets today. LOTS AND LOTS of space to create!
Something happens in the room when students are provided with an empty table and are asked to “create”. Many take pause. Some initially stare at the iPad, as if making a wrong move will break it. Others dive right in and look at the graph happening simultaneously… and “play”. The feedback the Desmos graph immediately provides encourages them to keep going with their patterns, or revise ideas. What I loved most about watching them create patterns in these empty tables was… many students did NOT start with (0, 0) as their first point! For some, that was an afterthought that *I* asked them to add at the end to see if their line segments continued to the origin. They were looking at patterns, relationships, and equal ratios to “create”… YES! Since they weren’t limited to a typical 10-by-10 coordinate plane on paper, they were able to be more flexible in their thinking.
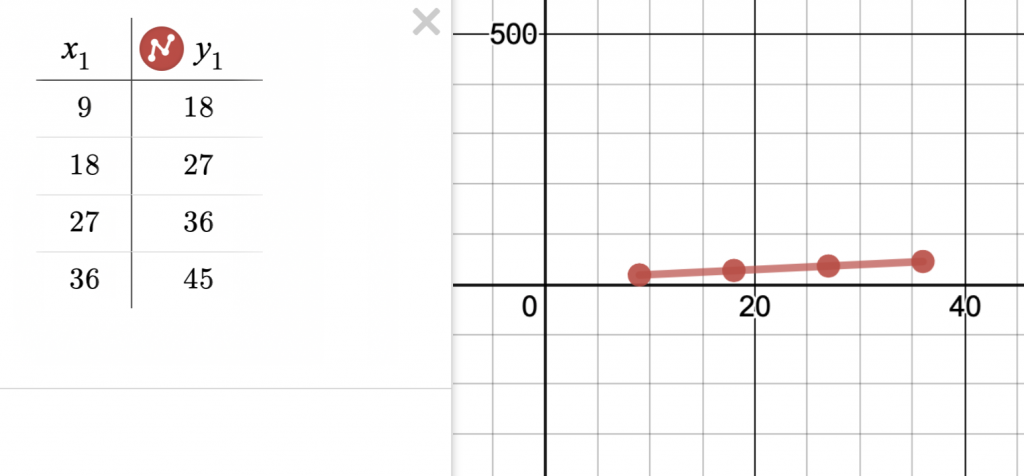
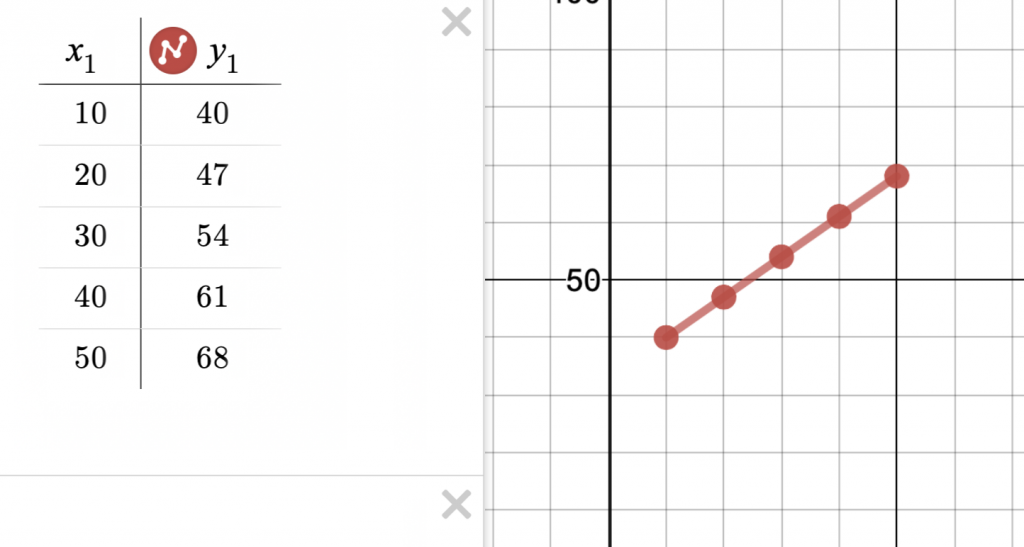
After sharing graphs and talking about several student creations, I used Teacher Pacing to navigate everyone to Screen 2, where students were prompted to fill an empty table of values to create a line that is non proportional. Again, with students creating, we had a wide variety of examples, and a few non-examples we could help students revise.
To close, I think having students experience ALL of these tasks was valuable. My “Three Bears” comparison here is more about how *I* was feeling at various points in the lesson, using various resources that accomplished different goals. Any one of these resources in isolation wouldn’t have been as powerful for students as using all three.
A message I want to share to encourage you is a friendly reminder that not every activity we do in Desmos or other tools has to be this huge, comprehensive entire-class-period or entire-lesson thing. Sometimes small creations used intentionally can make an impact! More about that here.


Hello there,
I am starting my last semester in January for elementary education and doing my full internship in a 6th and 7th grade math class. I love reading your blogs and seeing all of the resources you use. It is great to see that when things aren’t going quite as planned, you add more resources or go in a different direction until the students understand the objective.
Any advise you can give me before I start this amazing journey?
Greetings!
Drafted a few years ago, but still relevant! 😉
http://www.mathycathy.com/blog/2013/11/a-message-to-21st-century-pre-service-middle-school-math-teachers/