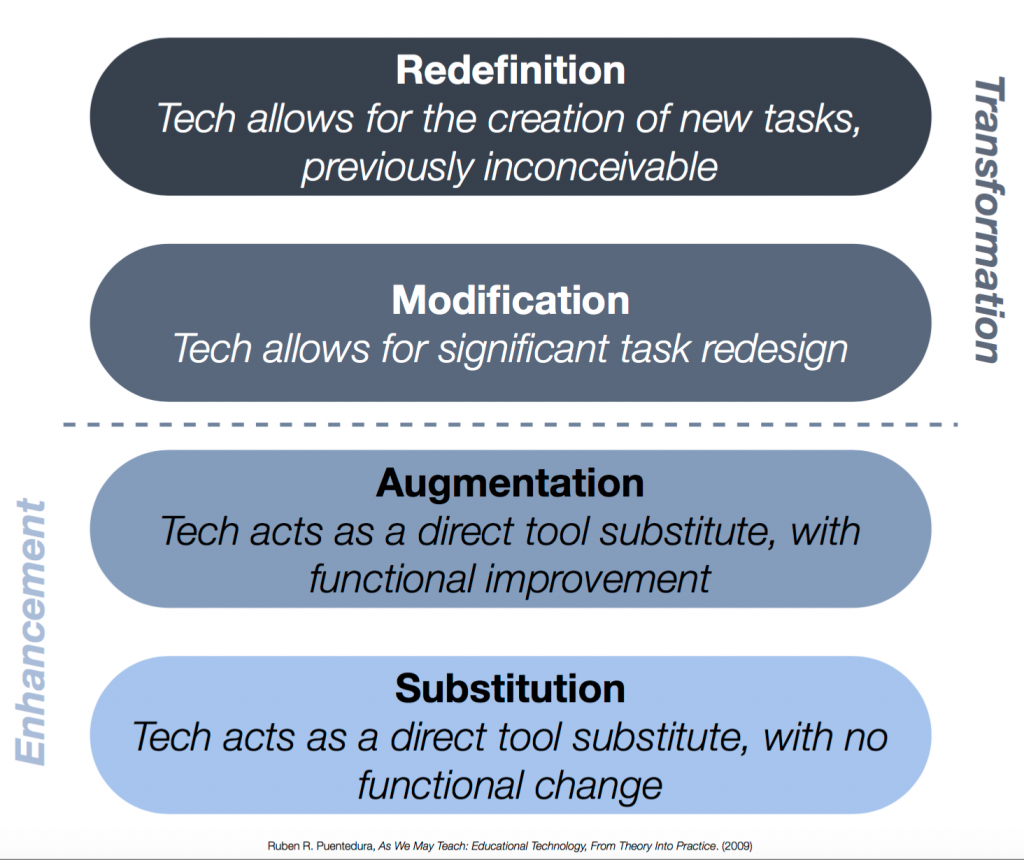
 The SAMR Model is a fundamental framework often used to help educators consider how and why to integrate technology. Teachers are encouraged to aim “above the line” to provide students with potentially transformative experiences, rather than simply enhancing tasks with technology. While this framework is helpful, I always find the four levels to be fuzzy. I also question anyone who tries to force an app or tool into one of four levels… to me, it’s always been about HOW technology tools are used that determine the impact.
Additionally, I’ve sensed a bit of a shift in my own technology use lately. While I find tremendous satisfaction in designing complete lessons using some of my favorite tech tools, there are plenty of days when I look at what my students are doing, and in the moment, I whip up a way to get the thinking that’s happening on sheets of paper and in small groups to a collection of student work samples that we can all talk about and learn from. It’s not poor planning… it’s the comfort of knowing the tools I have at my access in a moment’s notice, and the confidence to know I can use them exactly when I need them!
Where do these in-the-moment discussions that technology makes possible “rank” in the SAMR model? I often wonder. From the outside, it may look like we’ve simply transferred a paper task to technology, ranking the whole thing “below the line”. However, the discussions and a-ha moments that happen make me think there’s a bit more transformation happening than meets the eye.
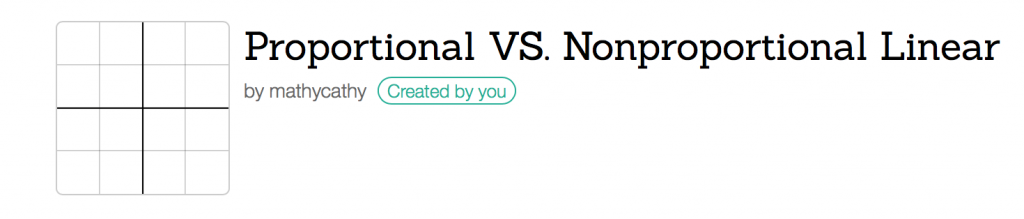
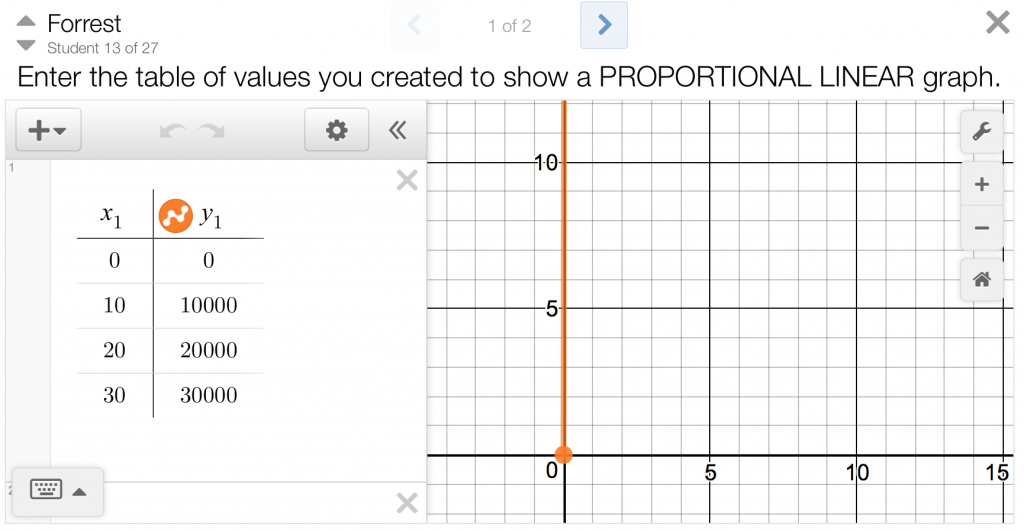
For example, a-la-Open-Middle style, I asked students to create two tables of values and two graphs such that the first was proportional linear and the second was nonproprtional linear. This quick prompt was part of a “foldable” I created several years ago. In the past, I just walked around and looked at student work, or had several students share their work using the document camera. However, this week as I watched students creating these representations in my first period class, I realized… I have Desmos Activity Builder now!
As they worked, it took me less than a minute to make this.
Suddenly, their papers became rough drafts, and the finished product moved to Desmos, where we could anonymously examine every student’s work, explore every response using the Overlay feature… and even zoom WAAAAY in or WAAAAY out to see what was happening at the origin in each case. Sure, I “substituted” a sheet of paper with Desmos, but I can’t accept that this was *only* substitution after all that creating, zooming, sharing, and discussing happened.
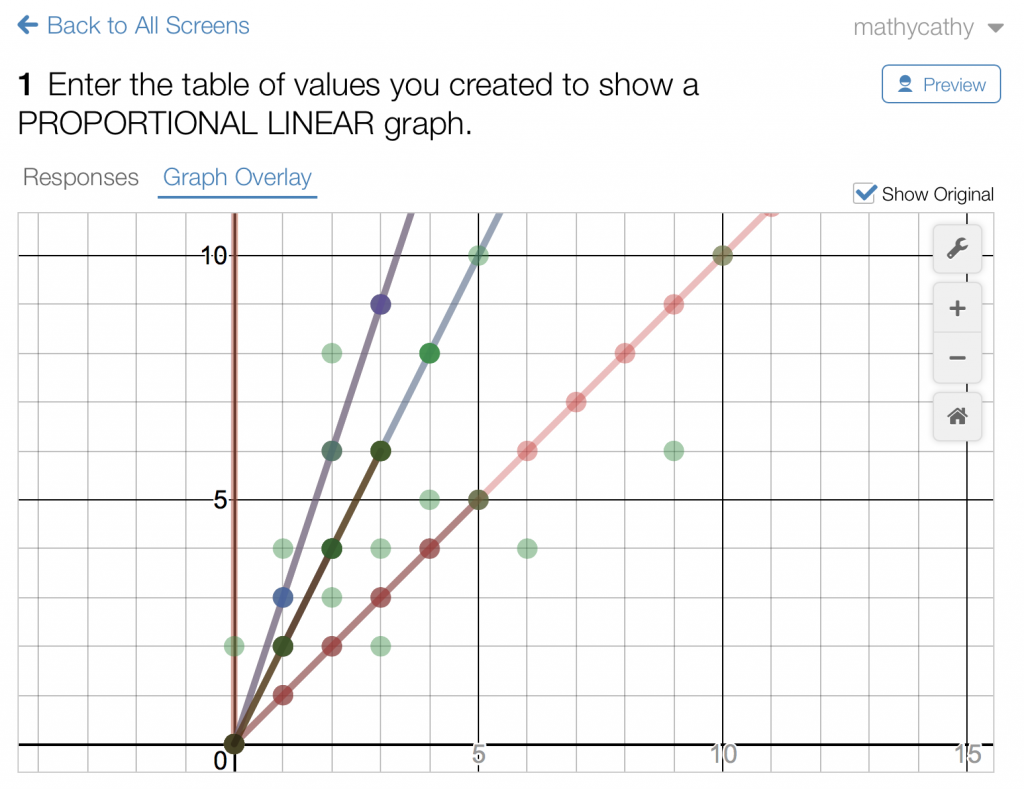
Showcasing Proportional Linear Relationships Using Desmos Overlay
Testing Desmos!
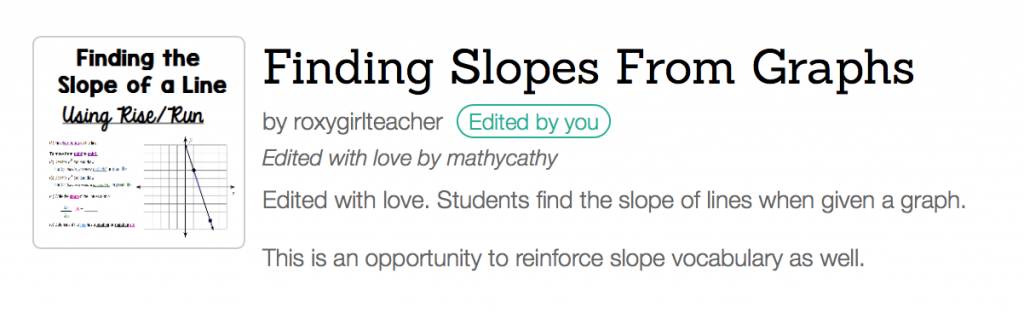
One evening this past week, I gave a “Desmos homework”, using this activity created and shared by Roxygirl Teacher. Again, at first glance one might say this served as a worksheet substitution.
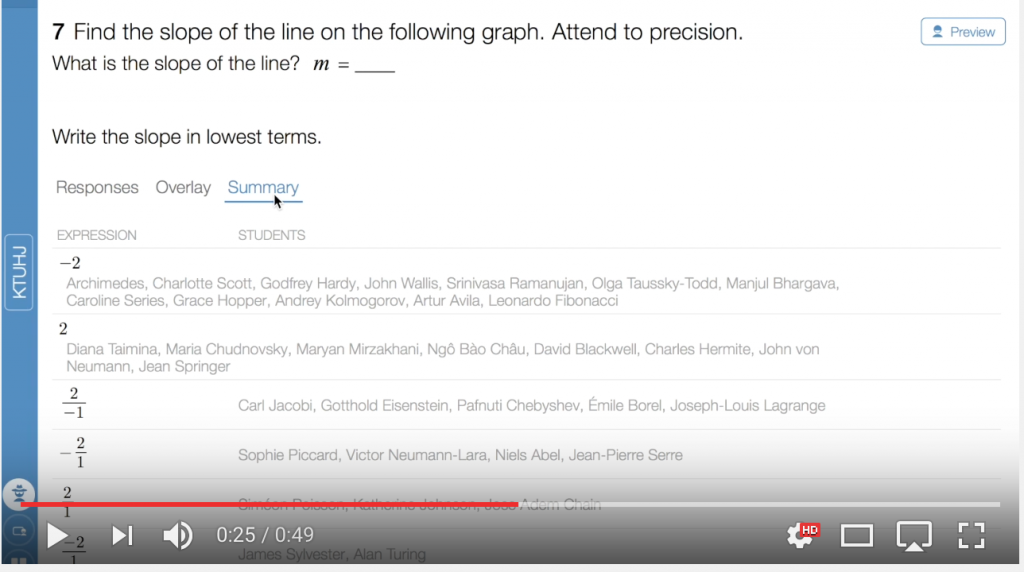
I intentionally gave the same class code to all 3 of my Math 8 classes, so we’d have a huge sample of responses to consider the following day. In class, I projected the teacher dashboard in Desmos, used Sketch to work through a problem with students, confirmed the correct answer, then took full advantage of the “Summary” feature to examine student responses. Discussions about equivalence, notation, and errors were fantastic! More than once, students had OMG epiphanies that they had messed up. They were thankful, as they have a quiz next week, and these discussions and comparisons of student work helped many students who, beforehand, didn’t know what they didn’t know. Instead of hearing students complaining about mistakes, they were thankful for their mistakes, and the realizations that some had written every slope ratio upside down! Some made sign errors repeatedly! One student even represented every slope as two values separated by a comma rather than as a ratio. And others… well… they just needed a re-count. 😉
Is it just me, or when you think you’ve seen every possible goof out there, a student comes up with a new one? Sometimes we can’t anticipate every weird thing kids are going to do. We try our best to be proactive, but there are some creative little buggers out there. Tools like Desmos and Nearpod help us teachers to help our students better.
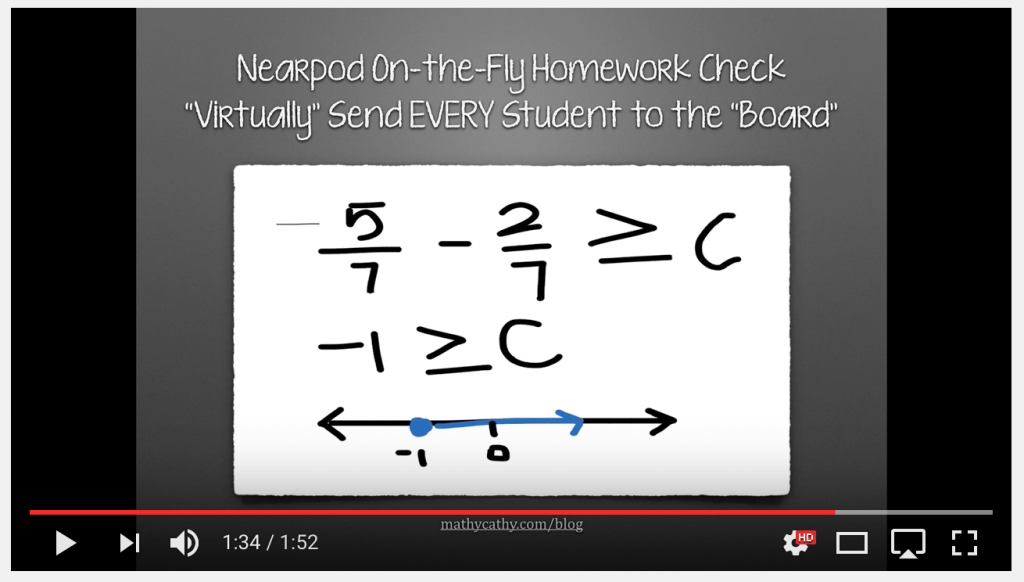
For example, I used Nearpod Draw It to spot-check several homework problems this week from an intro lesson with my Algebra students. After students worked a problem in Nearpod, I clicked through every problem briefly, asking students to make the first lap about “noticing”. After we quietly observed every problem (anonymously) we started to talk about trends, particularly in errors. I saw repercussions of incorrectly generalizing “Trick” 6.5 in full force with these simple inequalities. I was genuinely surprised by how many students fell for the “trick”! Granted, I’m focusing on student errors here… plenty did well… but *they* needed to see this work and so did I! Afterwards, I was able to generate a quick ThatQuiz assessment to check that our discussions helped dispel wrong thinking.
If we don’t invite our students to share their thinking, and provide an environment where they feel comfortable sharing, we’re missing out on many learning opportunities!
How do you empower every student to participate and share mathematical thinking?
How do you handle student mistakes?
What are the best ways to address “tricks” that are being generalized incorrectly?
What is technology’s role in this process?